The Big Graph
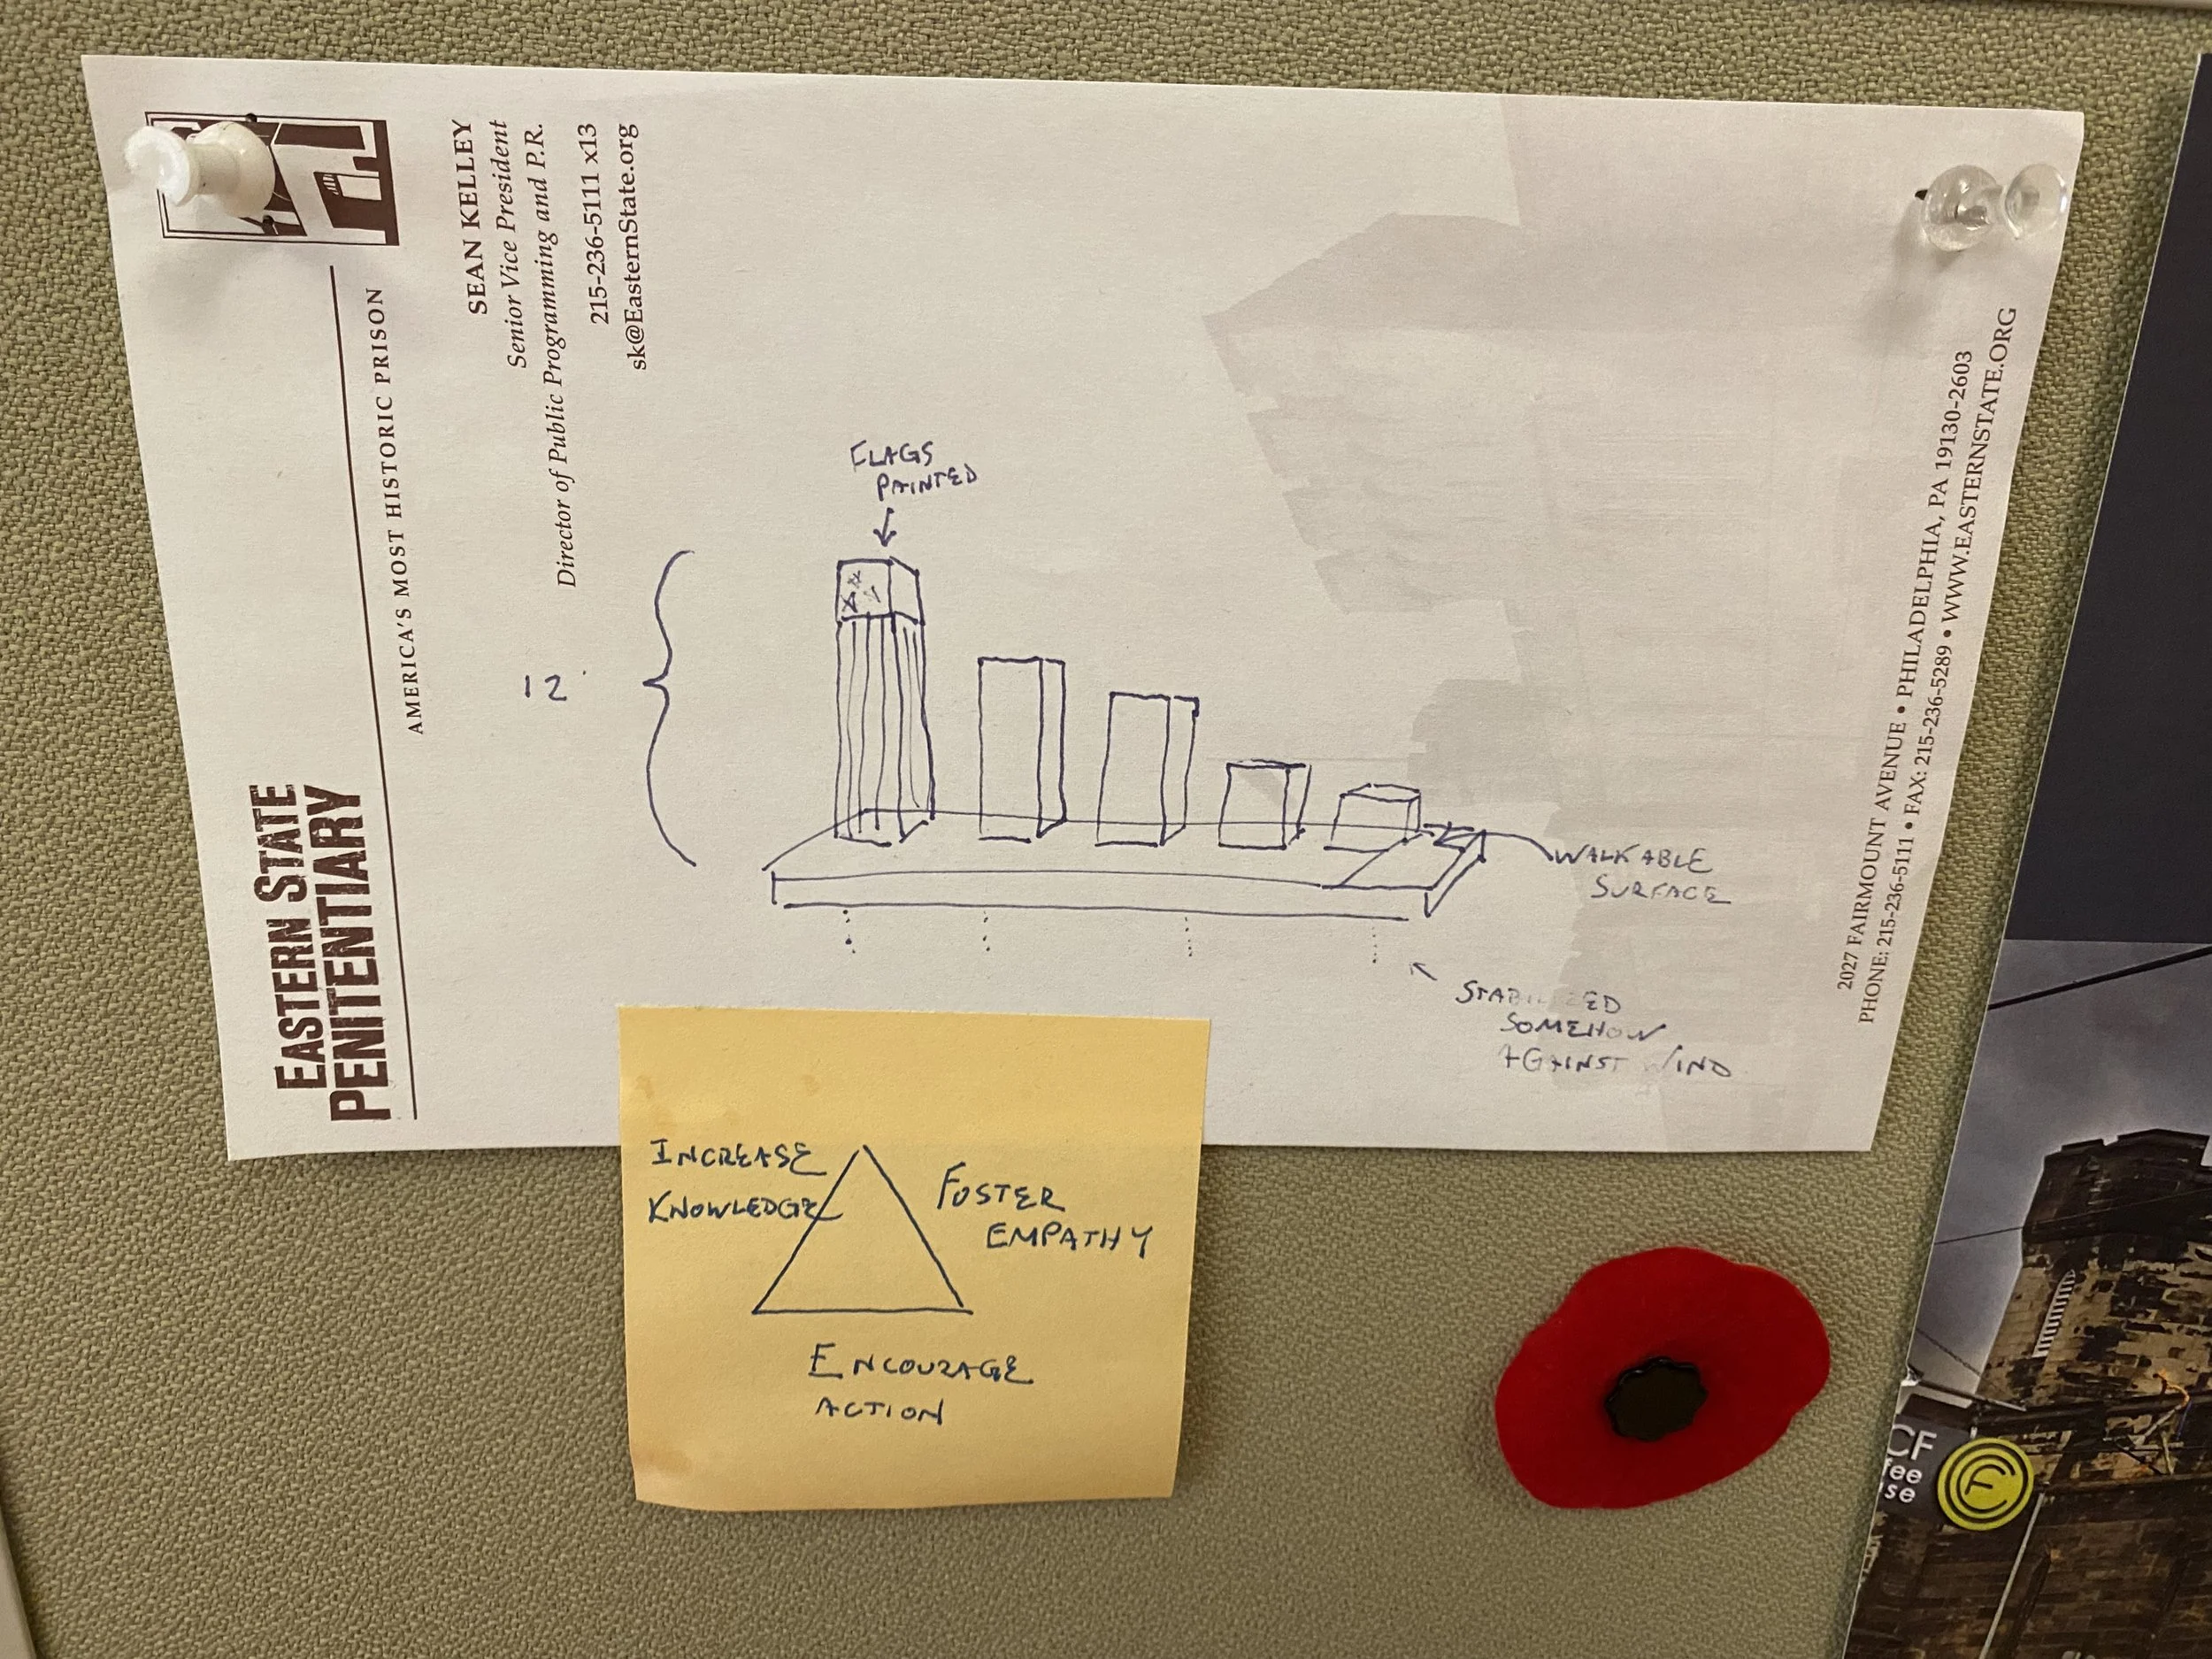
Sean’s original sketch of The Big Graph, made during a conversation about what we should be doing in museums and historic sites. Originally the primary side of the Graph, where visitors first approach, would have been the nations of the world with their rates of incarceration. Over time, the design shifted to focus on the U.S. rate of incarceration over time—emphasizing how recently we moved to a mass incarceration model—with the nations of world moving to the narrow edge.
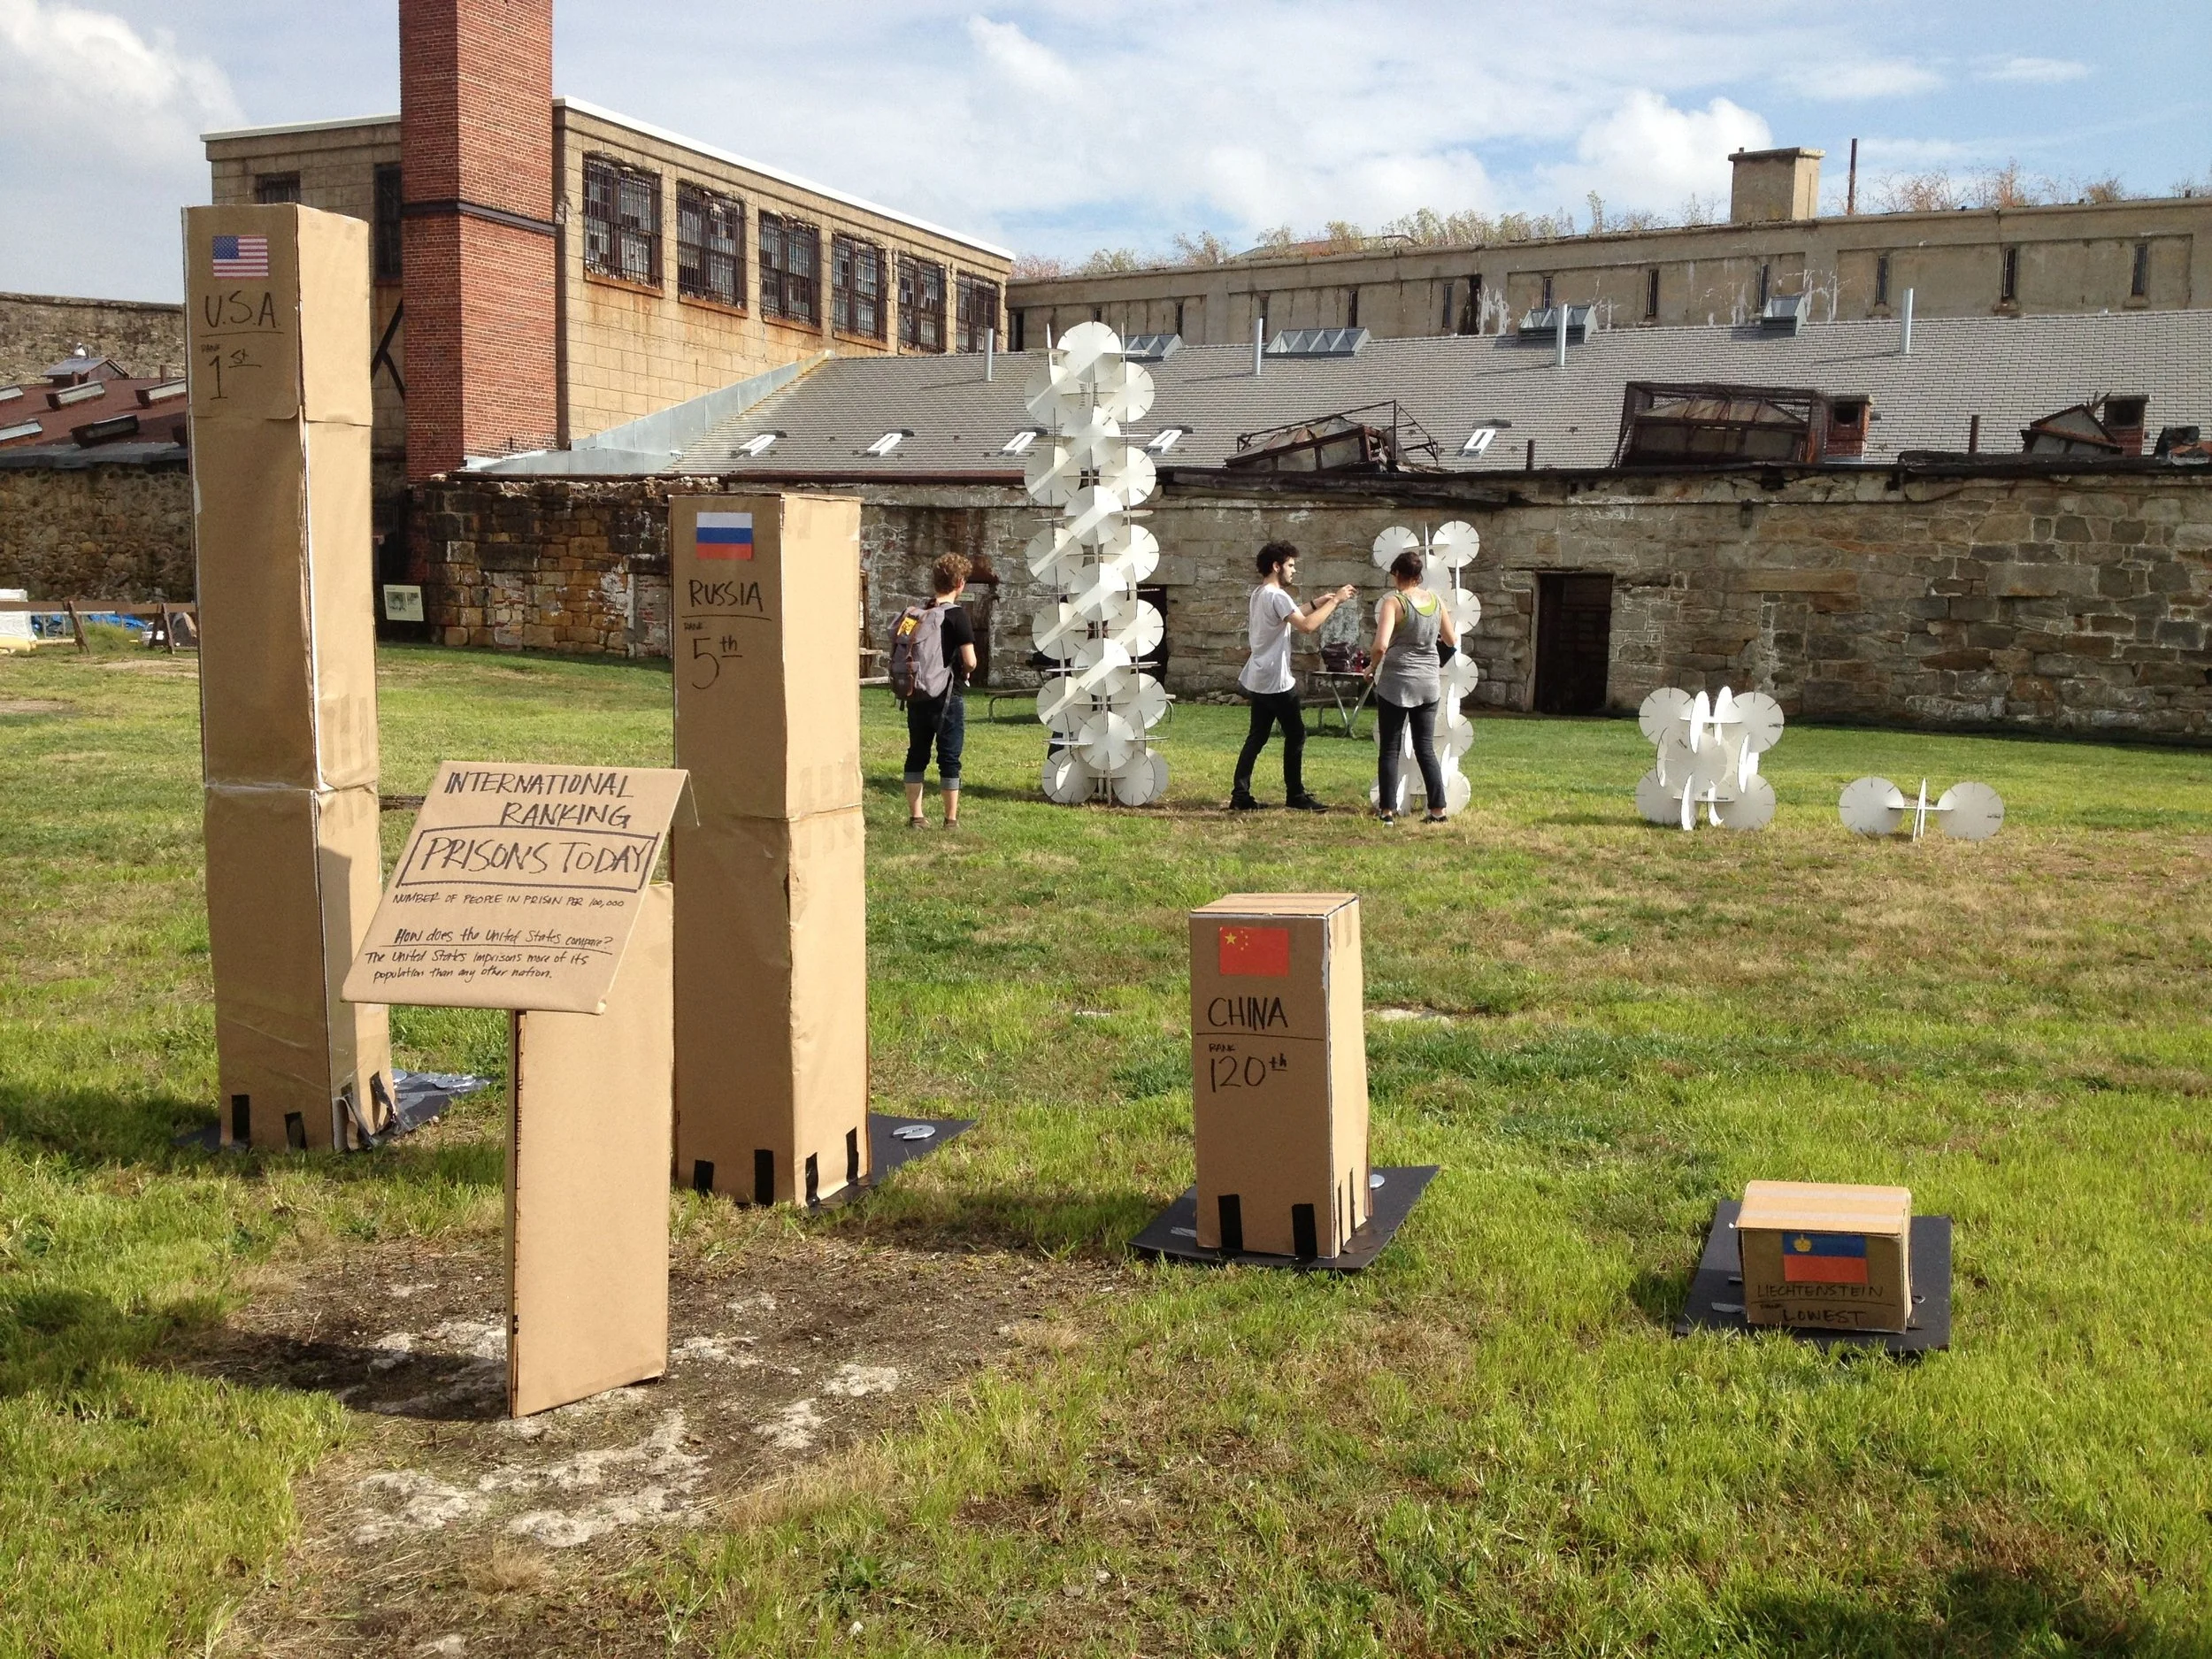
Prototyping The Big Graph with graduate students from the University of the Arts, fall 2013

Sean designed and oversaw the fabrication of The Big Graph over the course of a year, from summer 2013 to summer 2014, when it was unveiled. It remains Eastern State Penitentiary’s signature exhibit, anchoring both audio tour and guided tour routes.
The infographic sculpture weighs nearly 3 tons.

Sean during The Big Graph installation.
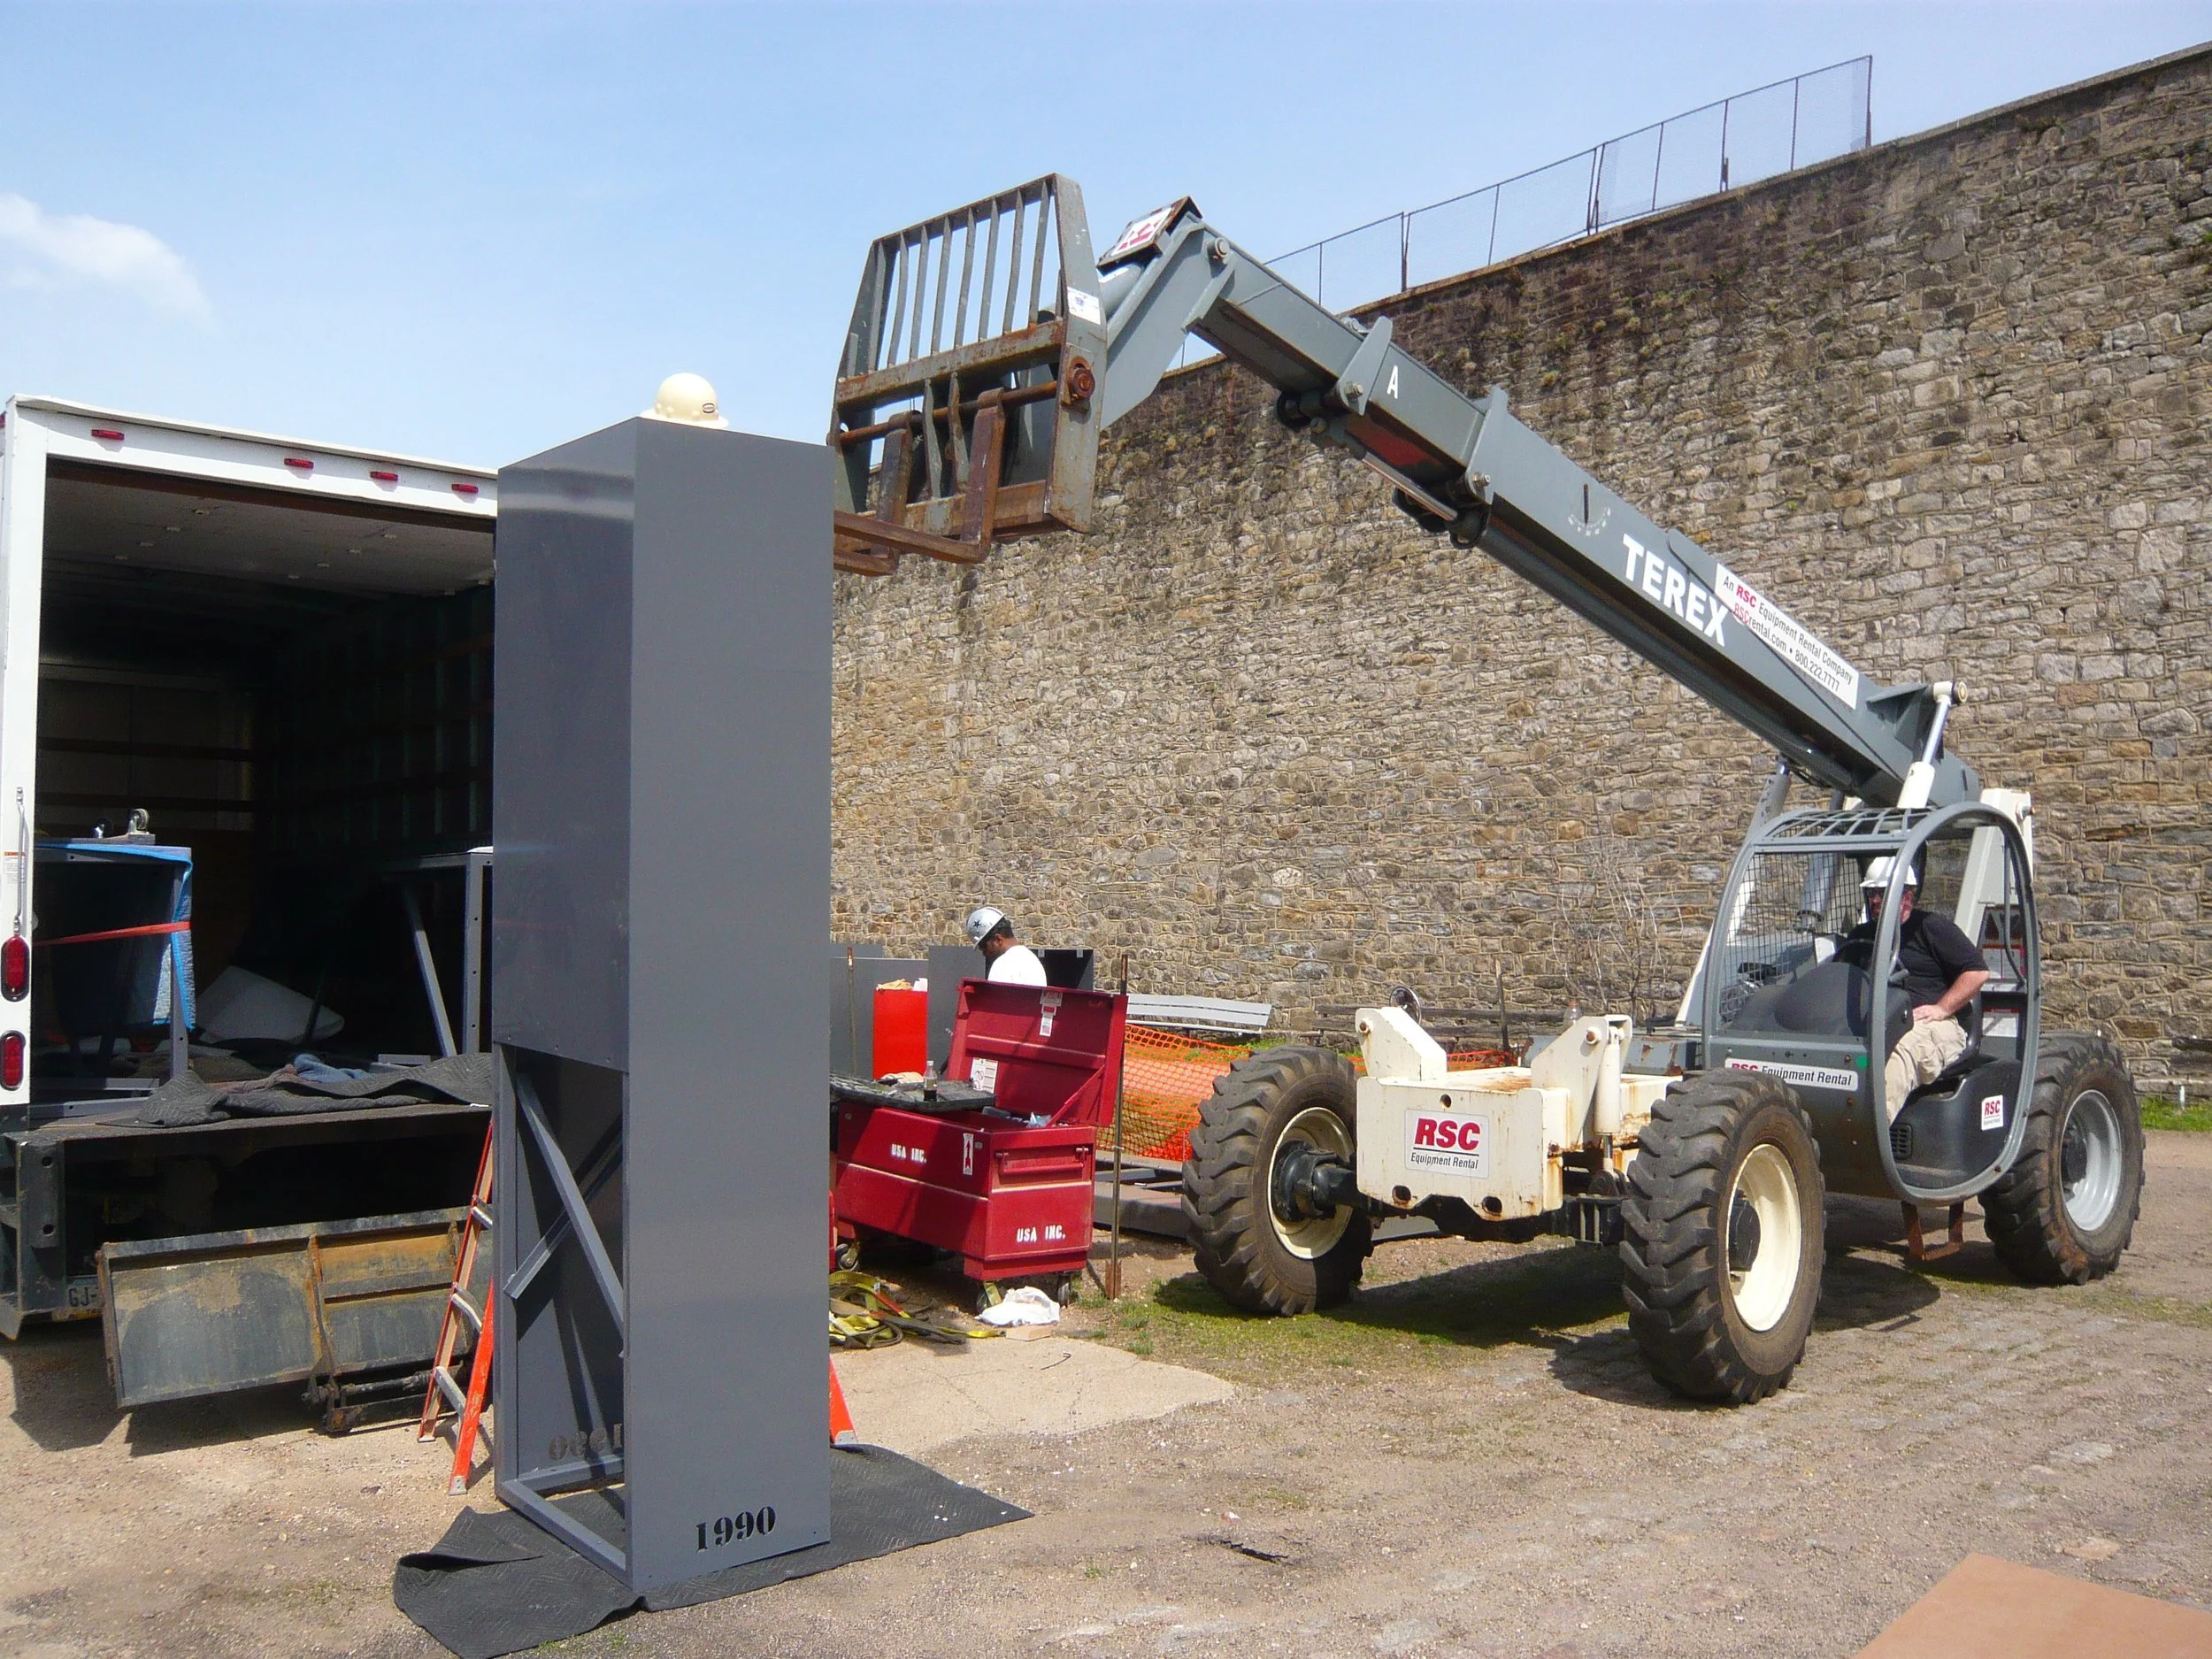
The Big Graph install, spring 2014

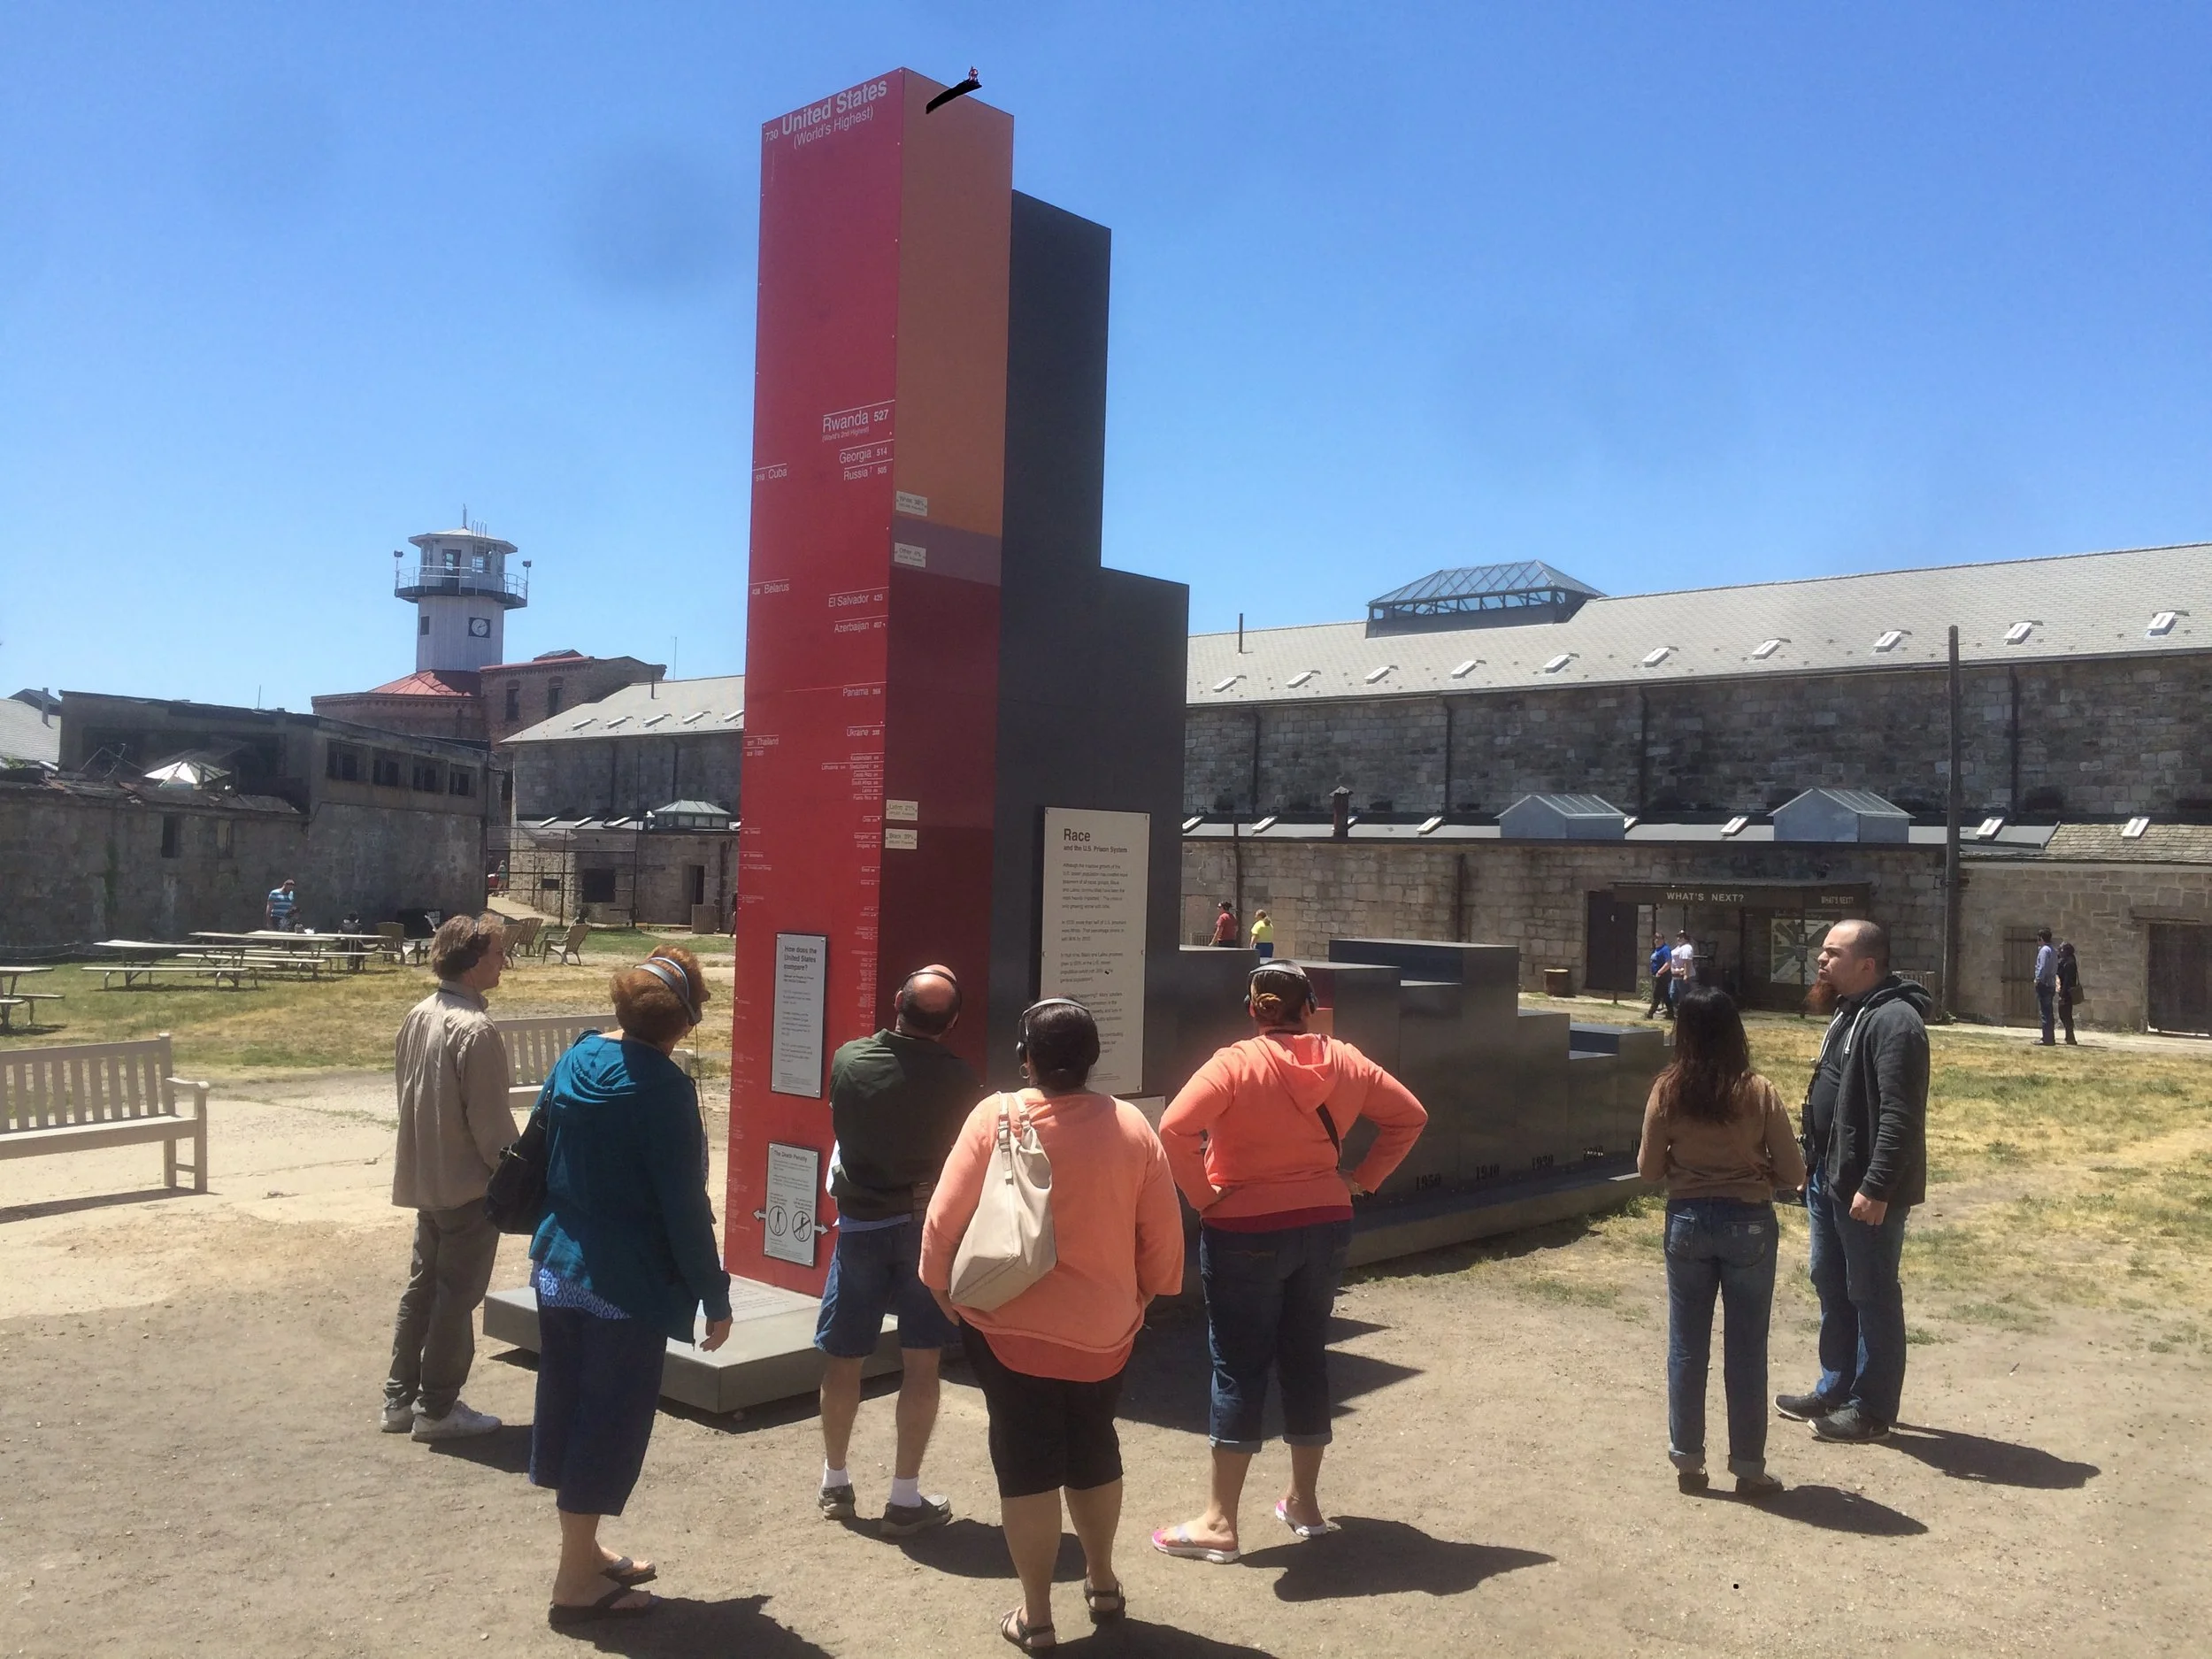
As visitors approach from the south, they encounter the American Rate of Incarceration from 1900 to 2010. The rate was steady until 1970, around the time that Eastern State Penitentiary closed. It has skyrocketed since then.
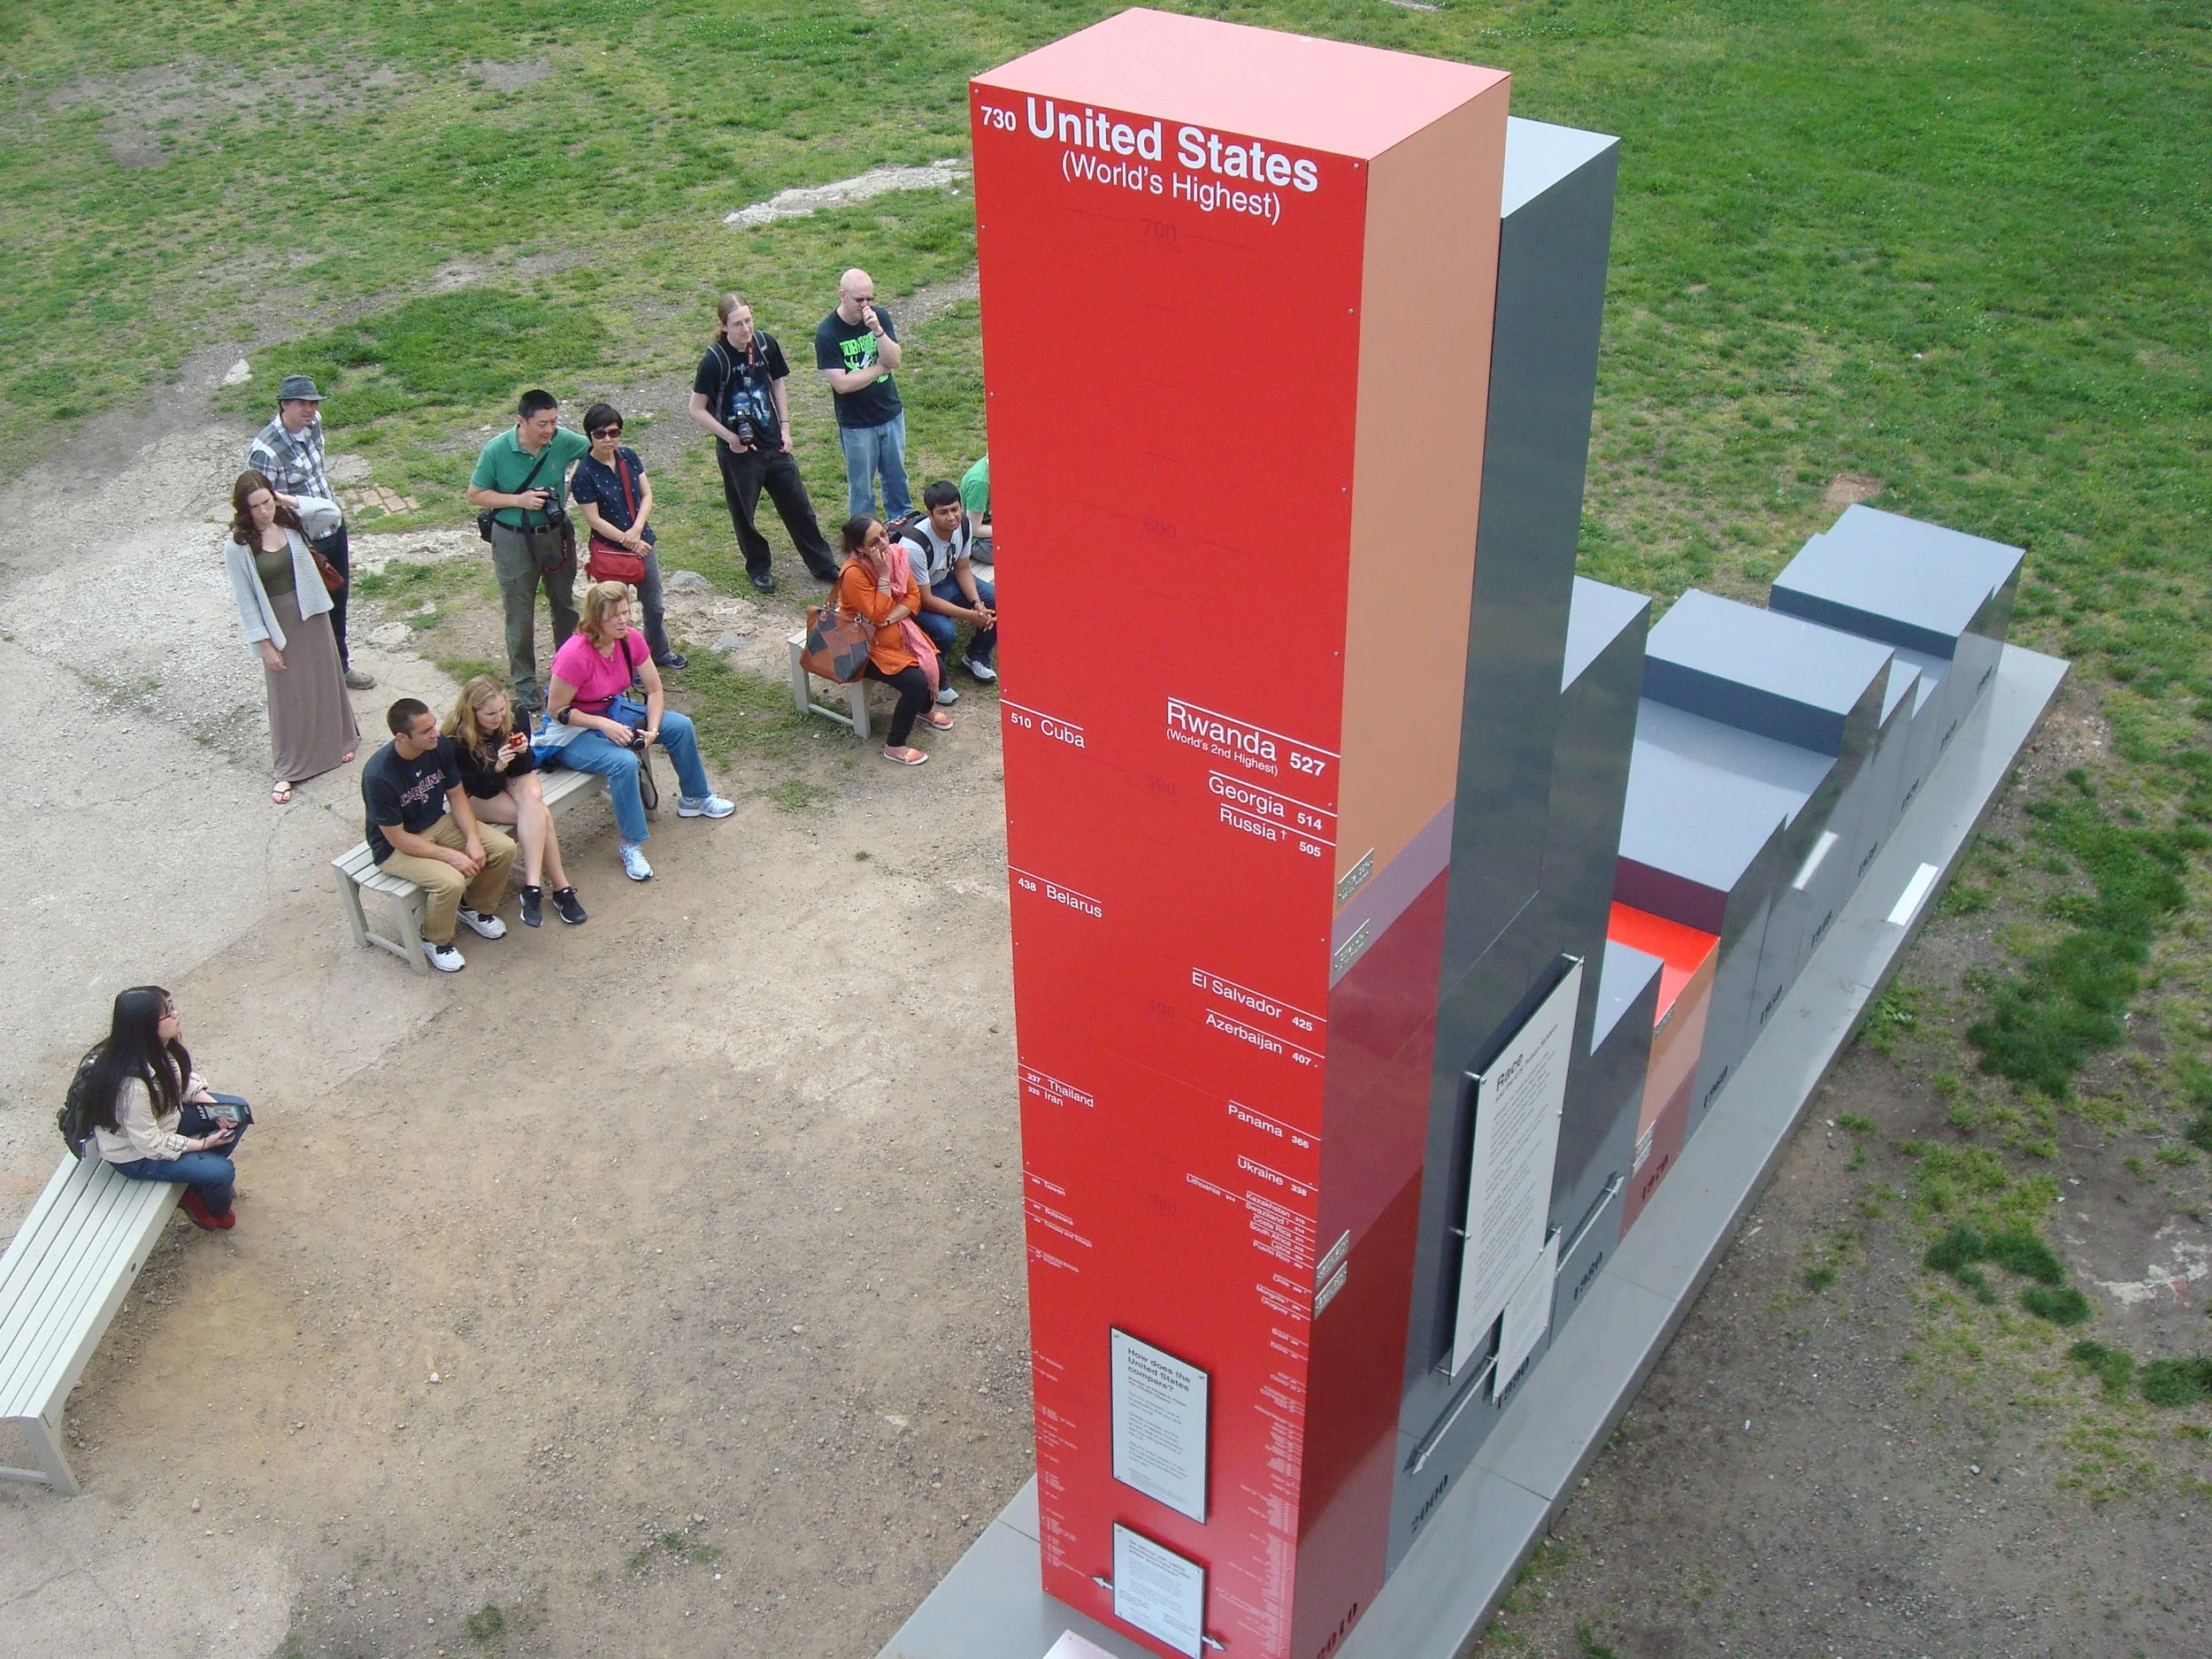
From the east, the Graph illustrates the Rate of Incarceration (that is, number of incarcerated people per 100,000 citizens) of every nation in the world. The U.S. had the highest rate, by far, until 2022, when El Salvador and three other nations dramatically increased their rates of incarceration.

From the north, the Graph illustrates the racial breakdown of America’s prison population, broken out by decade. The shameful racial disparities seen in 1970 have grown worse in the era of mass incarceration. The text asks, What should our nation do to address this crisis?
Visitors on Eastern State’s Voices of Eastern State audio tour reflect on the era of mass incarceration at The Big Graph. Sean edited the audio tour in 2014 to incorporate the Graph as the final stop.
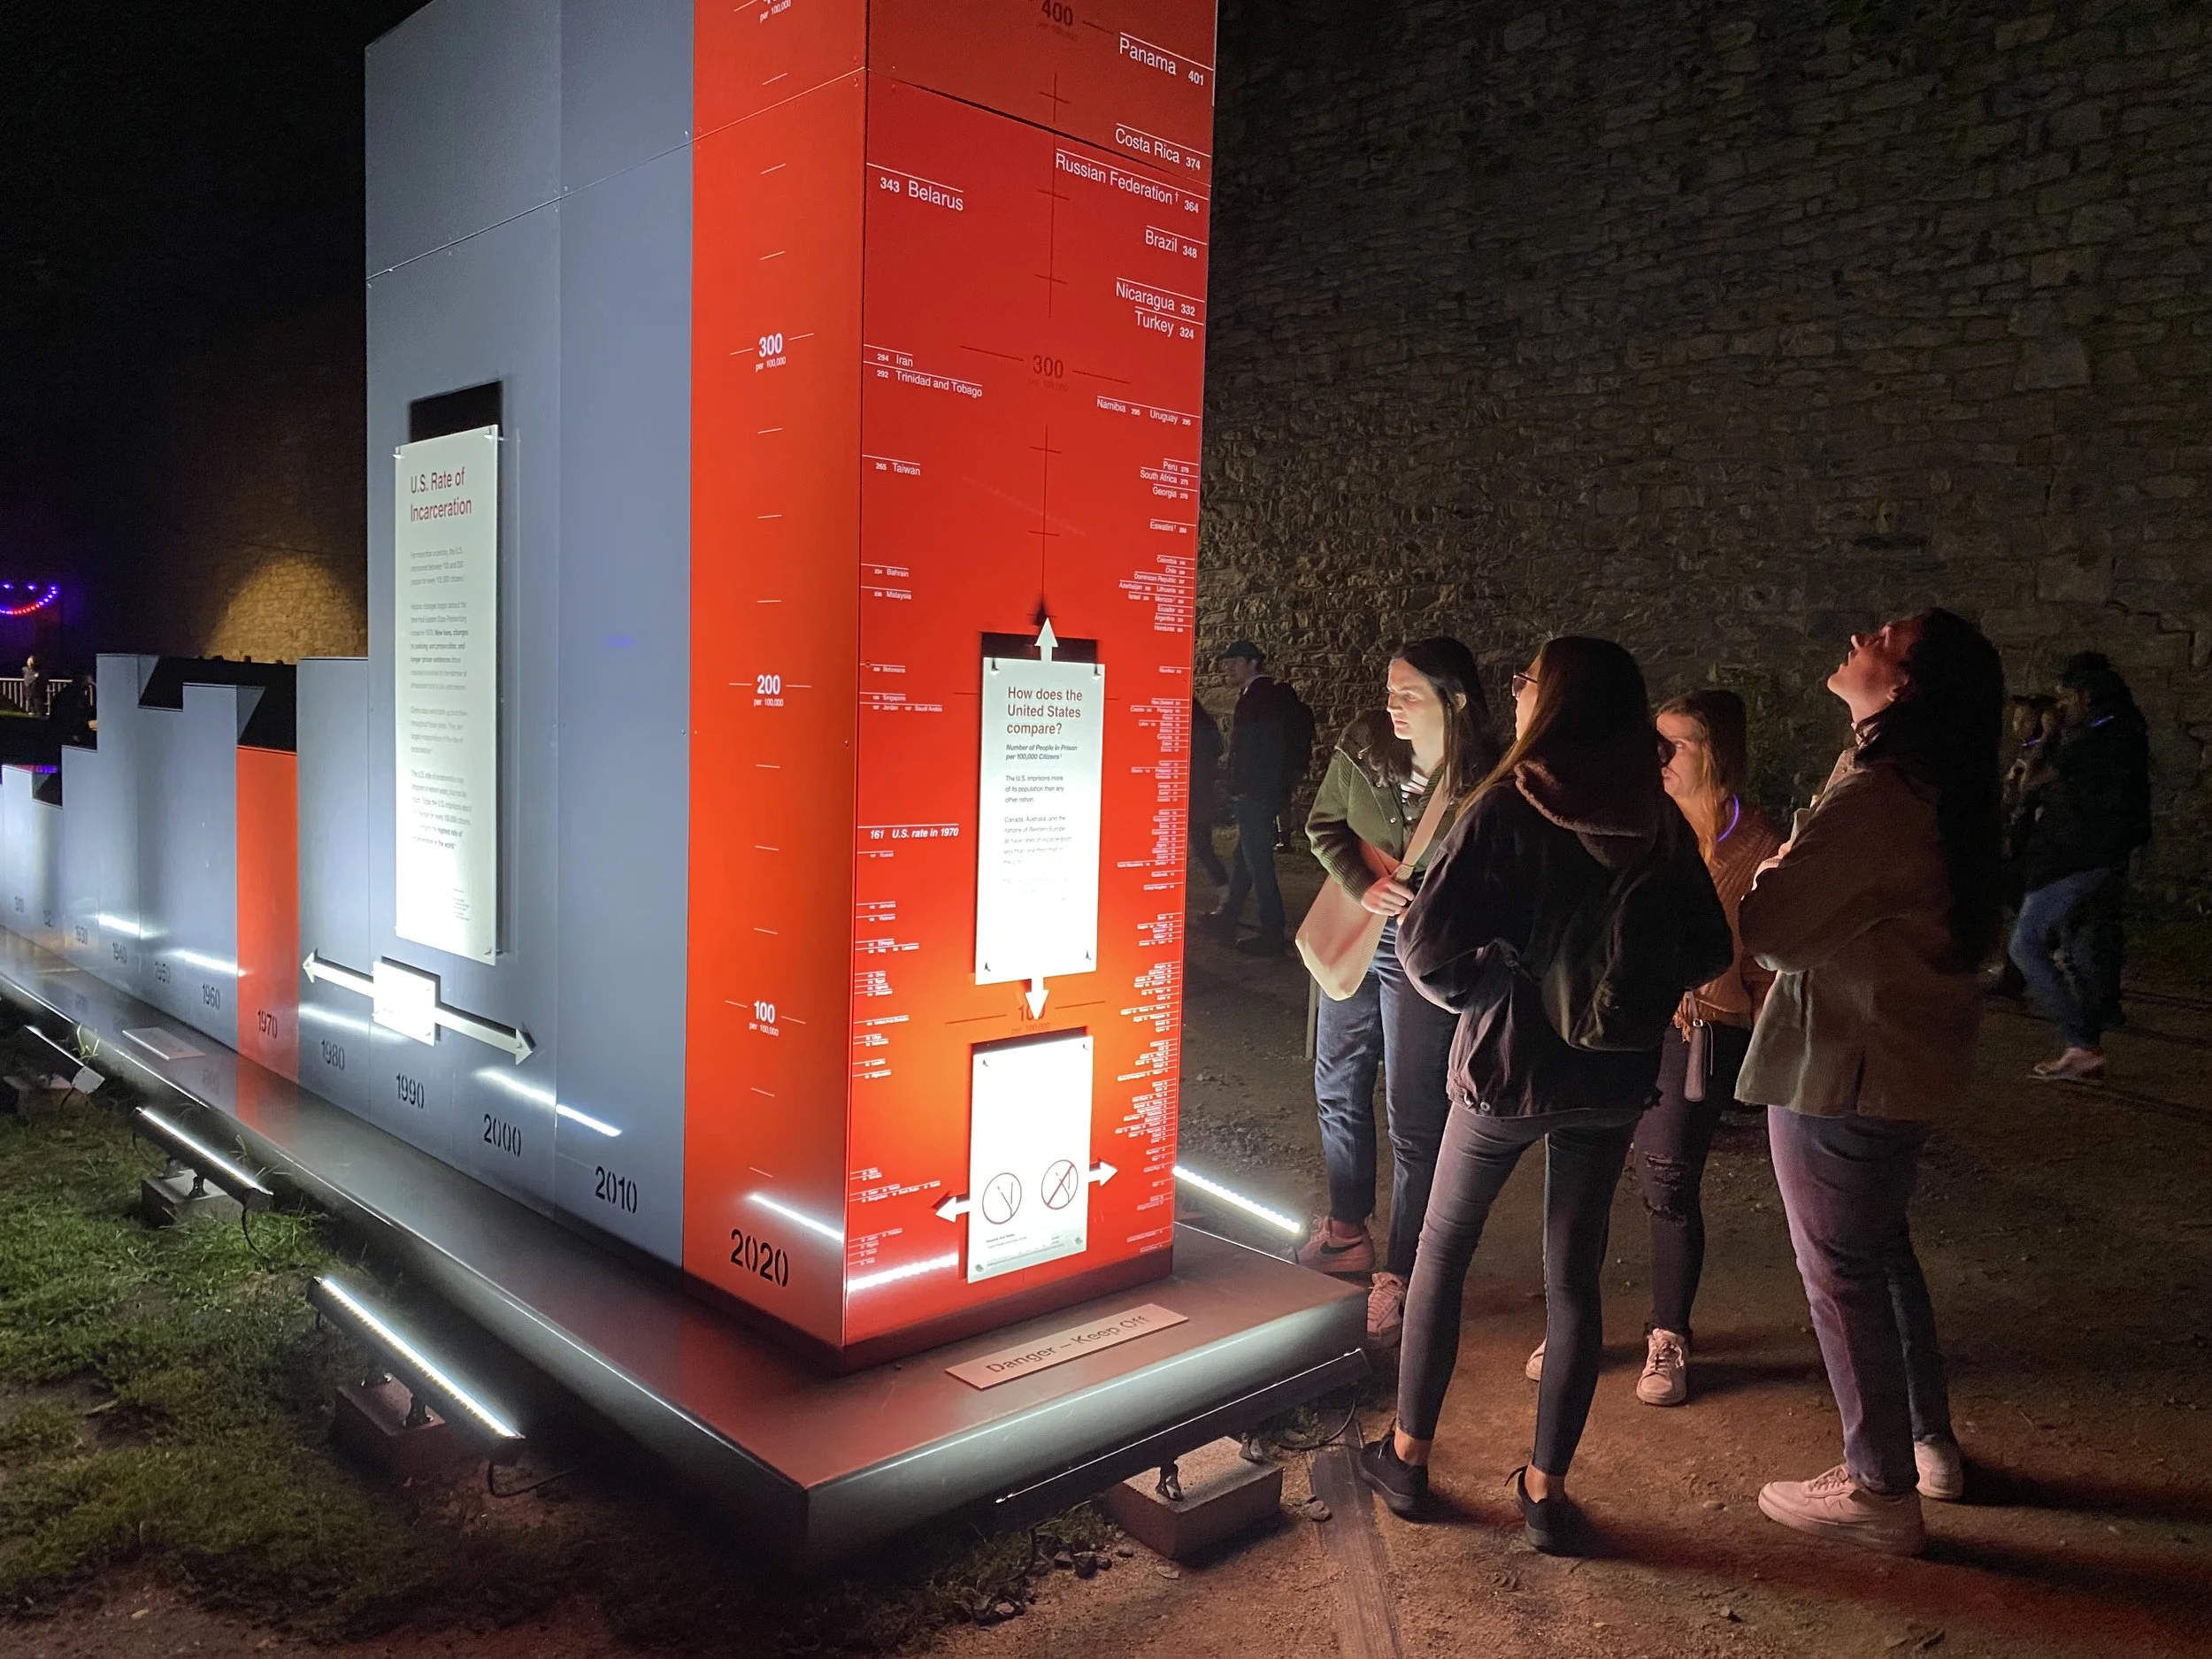
Visitors to Halloween Nights debate the root causes of mass incarceration at The Big Graph, fall 2022.